Predicting stock prices is akin to the attempts of alchemists in the Middle Ages to transmute lead into gold. Just as alchemists sought to unlock the secrets of transformation, statisticians and investors alike strive to decipher the patterns and signals hidden within market data. Traditional models often assume that stock prices follow a Brownian motion, making them appear entirely random and unpredictable. However, the reality is far more nuanced. While stock prices may exhibit elements of randomness, they are also influenced by a myriad of external factors, including news articles detailing significant events such as annual general meetings or company scandals.
In the fast-paced world of stock trading, staying ahead of the curve often means processing vast amounts of information in real-time. Investors are constantly seeking tools that can help to make more informed decisions amidst the chaos of market fluctuations and news updates. In recent years, advancements in natural language processing (NLP) and machine learning have paved the way for innovative approaches to analyzing market sentiment and risk.
In this blog post, we’ll explore how RiskBERT, can be leveraged to gain insights into stock market dynamics. In particular we try to figure out if, given the open price, a news release during the days is related to the closing price of that day.
Introducing RiskBERT
Built upon the foundation of BERT (Bidirectional Encoder Representations from Transformers), RiskBERT harnesses the power of deep learning to extract signals from textual data to quantify and assess the potential impact of news events on stock prices.
Analyzing Apple Inc. (AAPL) Stock
To demonstrate the capabilities of RiskBERT, let’s delve into a case study focusing on Apple Inc. (AAPL) stock. We’ll walk through a Python script that fetches news articles related to AAPL from a financial API, retrieves historical stock price data using Yahoo Finance, and applies RiskBERT to analyze the relationship between news sentiment and stock price movement.
Fetching News Data
We start by retrieving news articles related to AAPL using the EOD Historical Data API. Since the API limits the number of records per call, we implement a loop to fetch data iteratively until reaching the desired timeframe.
import requests
import pandas as pd
import yahooquery as yq
import matplotlib.pyplot as plt
import numpy as np
from RiskBERT import normalLoss
from RiskBERT import RiskBertModel
from RiskBERT import trainer, evaluate_model
from RiskBERT import DataConstructor
import torch
from transformers import AutoTokenizer

i=0
start_from= datetime.datetime.today().strftime("%Y-%m-%d")
while True:
    try:
        url = f'https://eodhd.com/api/news?s=AAPL.US&offset=0&limit=1000&to={start_from}&api_token=demo&fmt=json'
        data = requests.get(url).json()
        if i==0:
            appl_news = pd.DataFrame( data )
        else:
            appl_news=appl_news._append(pd.DataFrame( data ), ignore_index=True)
        start_from=str( min( pd.to_datetime(appl_news["date"]).dt.date ) )

        if min( pd.to_datetime(appl_news['date']).dt.date )<=datetime.date.fromisoformat('2016-02-19'):
            break
        i=i+1
    except Exception as e:
        print(e)
        break
Retrieving Stock Price Data
Next, we obtain historical stock price data for AAPL from Yahoo Finance. This data will serve as the basis for our analysis, allowing us to correlate news events with changes in stock prices.
end = max(appl_news["date"])
start = min(appl_news["date"])

tq = yq.Ticker("AAPL")
stock_data = tq.history(start=start, end=end)
Preparing the Data
Before applying RiskBERT, we preprocess the data and join the news articles with the corresponding stock price data. We also perform feature engineering to enrich the dataset with additional information relevant to our analysis.
appl_news["daydate"]=pd.to_datetime(appl_news["date"]).dt.date
stock_with_news = stock_data.merge(appl_news,left_on="date",right_on="daydate", how="left")

stock_with_news = stock_with_news.dropna()
stock_with_news["label"] = np.log(stock_with_news["close"])-np.log(stock_with_news["open"])
stock_with_news["num_symbols"] = stock_with_news["symbols"].apply(lambda x: len(x))
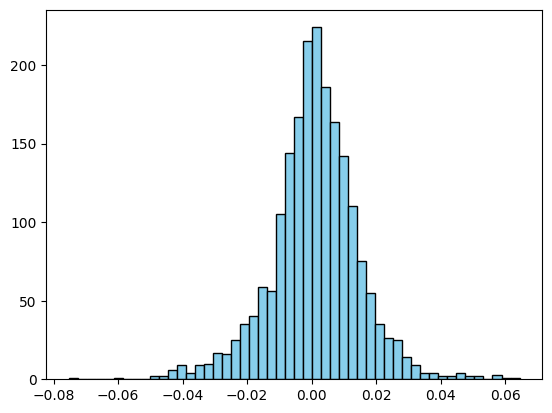
Analyzing Stock Price Distribution
To determine the correct distribution for RiskBERT, we plot a basic histogram of the stock price changes. The distribution appears to be fairly “normal,” validating our choice of using the normalLoss as the loss function for RiskBERT. This is what to be expected theoretically which should not be surprising for the frequent reader of this blog (see https://www.thebigdatablog.com/does-my-stock-trading-strategy-work/)
plt.hist(np.log(stock_data["close"])-np.log(stock_data["open"]), bins=50, color="skyblue", edgecolor="black")
Applying RiskBERT
With the data prepared, we proceed to apply RiskBERT to analyze the relationship between news sentiment and stock price movement. We utilize a pre-trained BERT model and fine-tune it for our specific task, incorporating additional features such as the number of symbols mentioned in each news article.
# Set device to gpu if available
device = torch.device("cuda:0" if torch.cuda.is_available() else "cpu")

pre_model= "distilbert-base-uncased"
model = RiskBertModel(model=pre_model, input_dim=1, dropout=0.4, freeze_bert=True, mode="CLS", loss_fn=normalLoss).to(device)
tokenizer = AutoTokenizer.from_pretrained(pre_model)

covariates = np.array(
        [
         stock_with_news["num_symbols"]
        ]
    ).T

my_data = DataConstructor(
    sentences=[ [x] for x in stock_with_news["title"] ],
    covariates=covariates,
    labels= [ [x] for x in stock_with_news["label"] ],
    tokenizer= tokenizer,
    device=device)

fitted_model, Total_Loss, Validation_Loss, Test_Loss = trainer(model =model,
        model_dataset=my_data,
        epochs=100,
        batch_size=1000,
        evaluate_fkt=evaluate_model,
        tokenizer=tokenizer,
        optimizer=torch.optim.SGD(model.parameters(), lr=0.001),
        device = device
        )

my_prediction=fitted_model(**my_data.prepare_for_model())
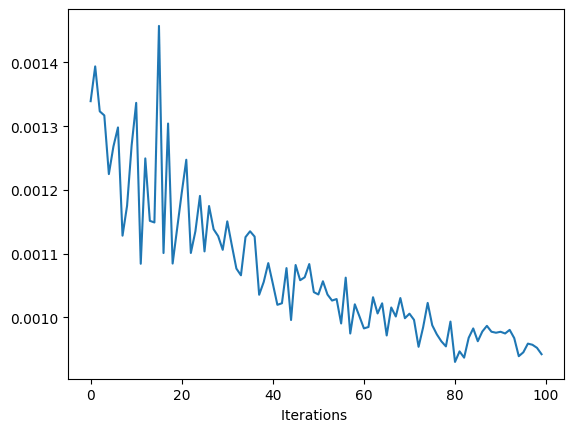
Unveiling Insights
In conclusion, our exploration into the world of stock market analysis with RiskBERT has yielded promising insights and results. Observing how the validation loss evolved over epochs provides valuable insights into the training process. Despite fluctuations, we can discern a clear trend of decreasing validation loss over time, indicating that RiskBERT continuously improves its predictive capabilities as it learns from the data. Thus RiskBERT is able to capture the impact of certain news on the closing price. However, before false hopes arise, the estimated model cannot be used for forecasts. The observed learning curve is mainly the estimate of the intercept. If you want to experiment with RiskBERT by yourself, the code is available at https://github.com/heikowagner/generalized-semantic-regression/blob/main/RiskBERT/simulation/stock_market_example.py.